Your hedge ratio is also a claim about forecast accuracy. Have you measured it?
- Link copied
The first FX hedging program I built started with a benchmarking exercise.
I looked at what comparable companies were doing. The approach was fairly consistent: hedge more of the near-term exposure, less further out.
So we adopted a layered approach.
The reasoning still makes sense. Cash flow expected next month is usually easier to estimate than cash flow expected six months from now. As uncertainty increases, hedge coverage should generally decline.
What I understood only later was that there are two separate decisions involved.
Benchmarking can help you design the structure of a hedging program. It cannot tell you exactly what hedge ratio is right for your business.
That number should, at least partly, come from your own forecast performance.
A hedge ratio contains an assumption
A typical layered policy might look something like this:
- Confirmed or highly certain exposure, 0–90 days: hedge 75–85%
- Forecast exposure, 90–180 days: hedge 40–60%
- Longer-dated forecast exposure: hedge 20–30%
These numbers are illustrative, not recommended targets.
The logic behind them is straightforward: forecast confidence tends to decrease as the time horizon increases.
But that immediately raises another question:
How quickly does your forecast accuracy actually decline?
If your policy says to hedge 50% of a six-month forecast, you are implicitly assuming that enough of that forecast is sufficiently reliable to support the hedge.
That is something you can measure.
Yet many finance teams start with a benchmarked hedge ratio without first comparing historical forecasts with actual cash flows.
For an SME establishing an FX risk-management program, benchmarking is often a reasonable starting point. It should not necessarily be the end point.
Start with three pieces of data
You do not need a sophisticated treasury system to begin. A spreadsheet can be enough.
1. Save each forecast version
Keep the forecast as it existed when it was produced.
Do not simply overwrite last month’s forecast with this month’s numbers.
For each material currency, archive the forecast date, expected cash-flow amount and expected settlement period.
If you have not been keeping historical versions, start now. The analysis will become more useful as the history builds.
2. Compare each forecast with what actually happened
Choose several consistent horizons.
For example:
- 4 weeks
- 13 weeks
- 26 weeks
Thirteen weeks is a common corporate cash-forecast horizon and provides a useful midpoint between near-term visibility and longer-term planning.
For each forecast vintage, compare the amount originally forecast with the amount that actually settled.
You are trying to answer a simple question:
Of the cash flow we expected at each horizon, how much actually materialized?
3. Measure direction as well as size
Do not look only at how large the forecasting error was.
Look at which direction it went.
A simple calculation is:
Forecast error = (Actual cash flow − Forecast cash flow) ÷ Forecast cash flow
If the result is consistently negative, the business is forecasting more cash flow than actually arrives.
If it is consistently positive, the forecast may be understating future cash flow.
You should then separate two issues.
Bias: Is the forecast repeatedly wrong in the same direction?
Variability: After accounting for that bias, how much do actual outcomes still move around?
That distinction matters.
Ideally, you should correct this systematic forecasting problem in the forecasting process. The remaining uncertainty is what the hedging program needs to manage.
If forecast amounts are sometimes very small or zero, percentage errors can become misleading. In those cases, compare the errors in currency amounts instead.
A simple example
Assume a Singapore-based company expects to receive USD and reports in SGD.
It reviews its historical USD forecasts against actual receipts and produces the following simplified results:
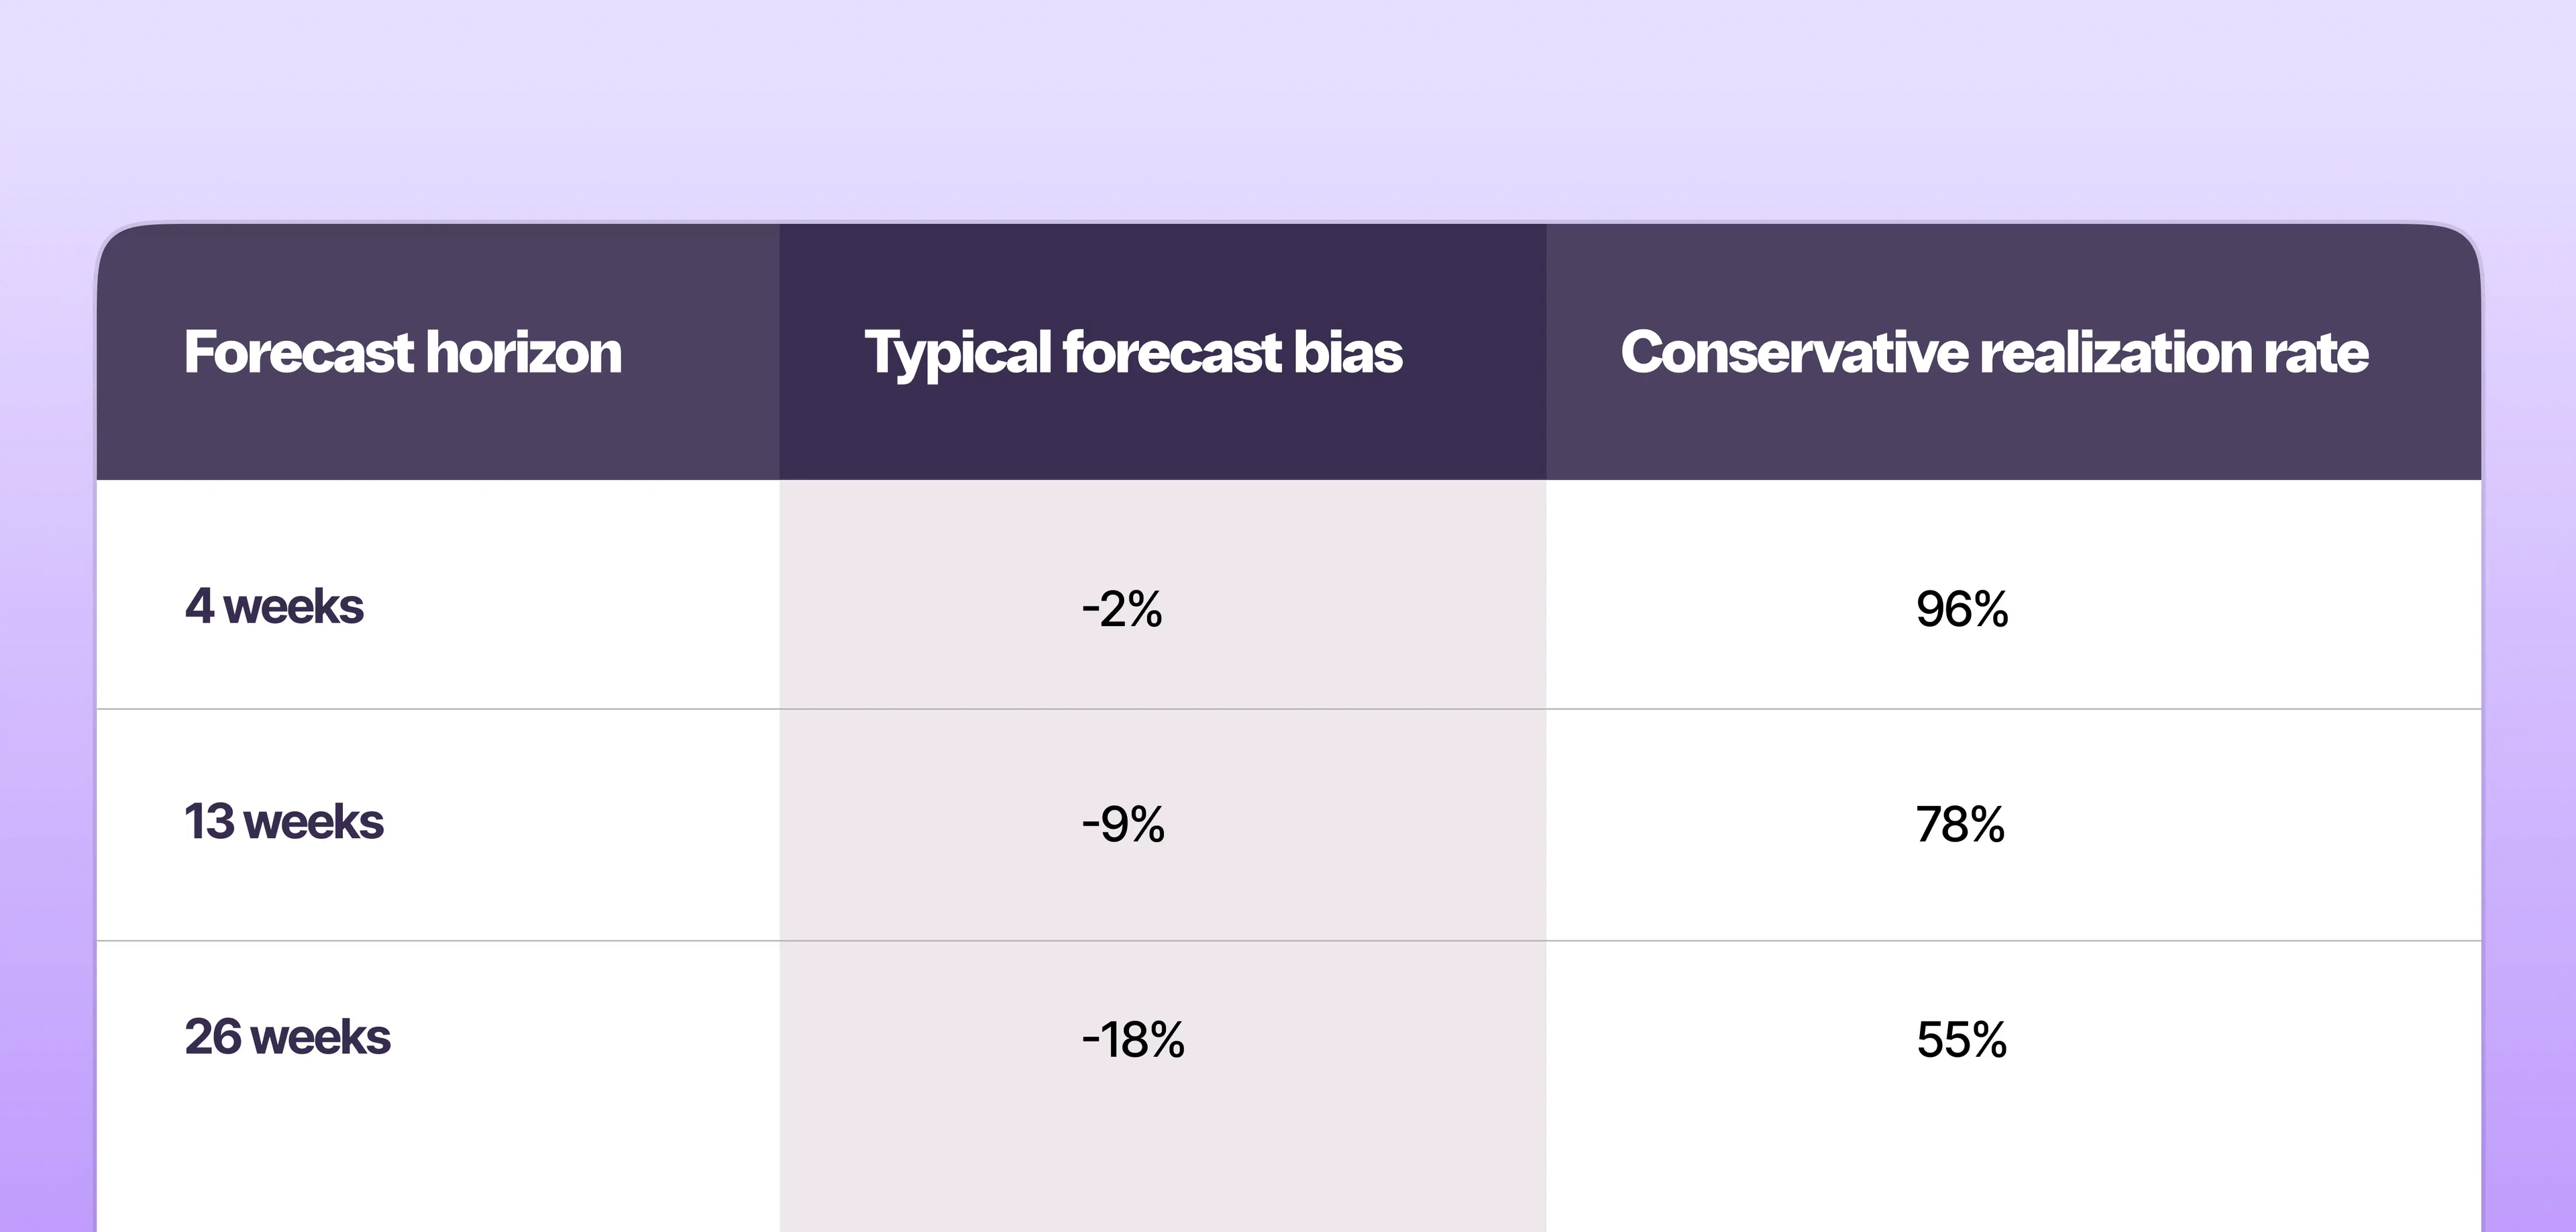
Figures are illustrative and are intended to demonstrate the method, not provide recommended hedge ratios.
Start with the right-hand column.
At four weeks, the company has historically received close to the amount forecast.
At 13 weeks, the reliable portion is lower.
At 26 weeks, only about 55% of the original forecast can be supported with the same degree of confidence.
That information can help the finance team decide how much of the forecast it is comfortable hedging.
It does not automatically mean the correct hedge ratios are 96%, 78% and 55%. Risk tolerance, hedge costs, liquidity requirements and other policy considerations still matter.
But the company now has evidence to support the discussion.
That is better than selecting 80%, 50% and 25% simply because another company does.
Correct forecasting bias before increasing the hedge
Now look at the left-hand column.
In this example, the company tends to overestimate USD receipts, and the bias gets larger further into the future.
At 26 weeks, actual receipts have typically been about 18% below forecast.
That should first trigger a forecasting question:
Why are we consistently forecasting too much?
Perhaps expected sales are being converted into cash too early. Perhaps customer payment behavior is changing. Perhaps pipeline assumptions are too optimistic.
Whatever the cause, increasing or decreasing the hedge ratio does not fix the forecast.
Correct the forecasting process first. Then measure the remaining uncertainty and use that information when setting the hedge ratio.
Otherwise, the business risks hedging a forecasting problem rather than managing an FX risk.
Why over-hedging deserves particular attention
Under-hedging and over-hedging create different problems.
If you under-hedge, part of the commercial exposure remains exposed to exchange-rate movements.
If you over-hedge and the expected cash flow never arrives, part of the derivative may no longer have an underlying commercial exposure against it.
That can leave the company with an unwanted FX position that may need to be closed, rolled or offset.
For an SME, this matters because the objective of hedging should be to reduce uncertainty around genuine business cash flows, not create a new currency exposure.
This is why forecast reliability should be one of the inputs into hedge sizing.
The further out you hedge forecast cash flows, the more important that measurement becomes.
Turn the policy into something you can test
Once forecast performance is measured, the hedging policy becomes easier to explain and review.
Instead of saying:

The finance team can say:
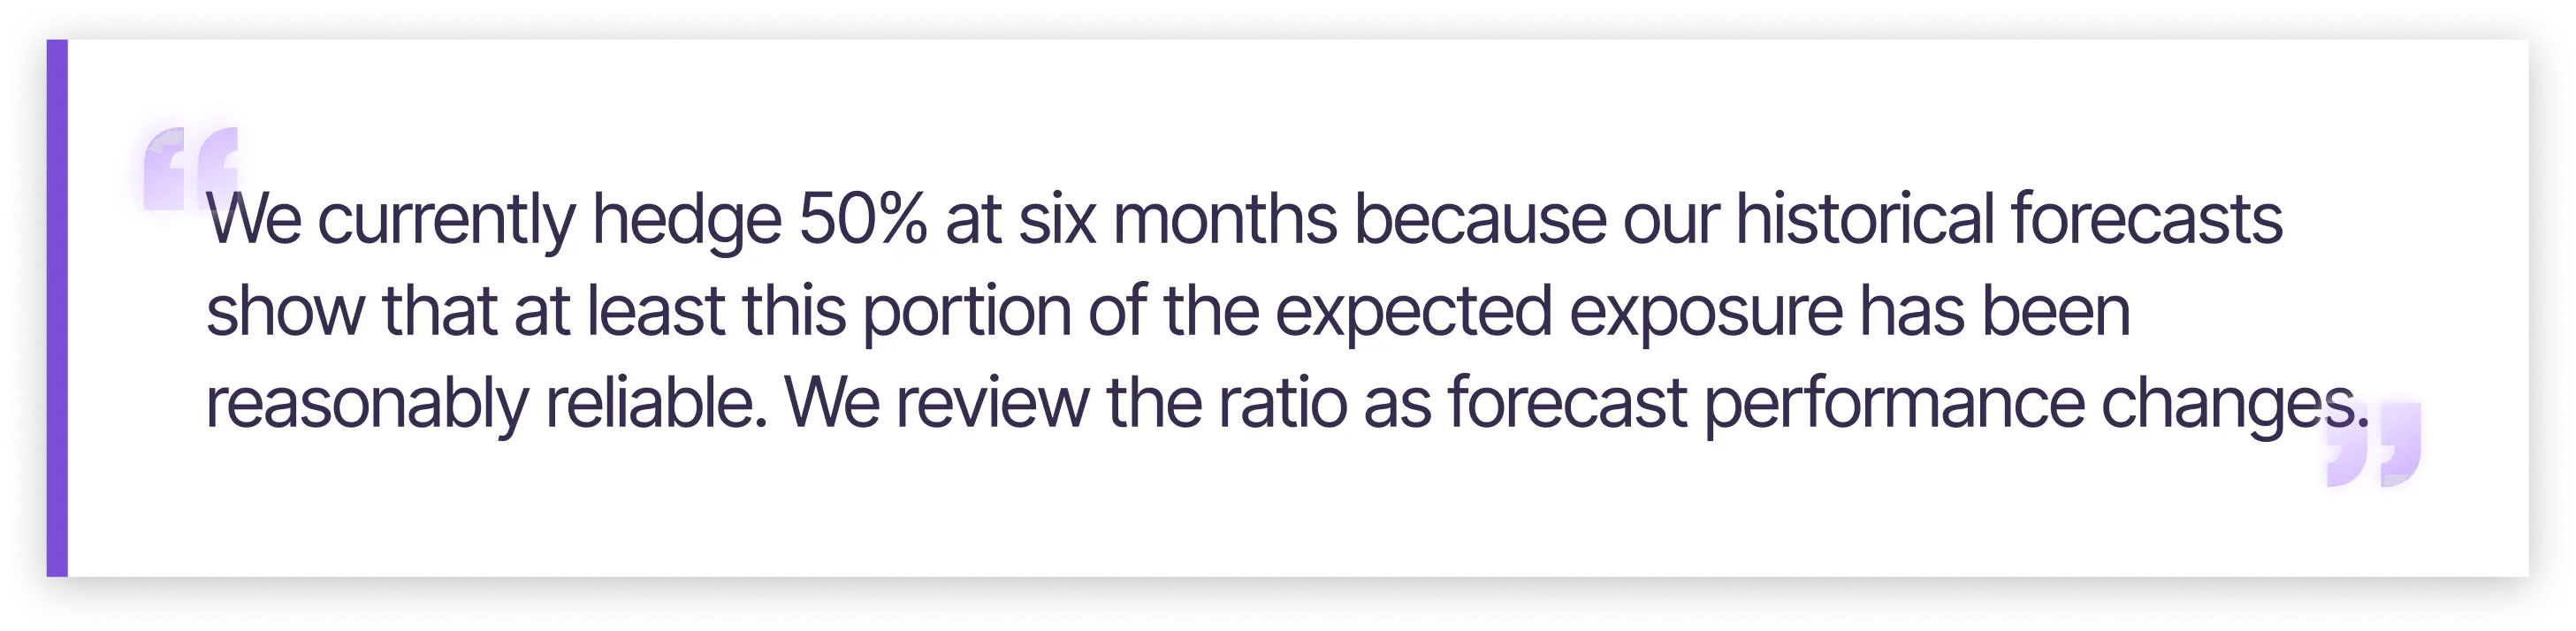
That creates a policy that can adapt.
A major new customer, expansion into another market, changes in payment terms, or greater customer concentration can all change forecast behavior.
When that happens, the hedge ratios can be reviewed against new data rather than simply remaining fixed because they were written into a policy two years earlier.
For a smaller finance team, the process does not need to be complicated:
- Archive each forecast.
- Compare forecasts with actual cash flows.
- Measure whether the forecast is consistently high or low.
- Measure how the reliability changes by horizon.
- Use that evidence alongside your risk appetite to review hedge ratios.
- Repeat the analysis periodically and whenever the underlying business materially changes.
Benchmark the framework. Measure the ratio.
Benchmarking still has value.
It can tell you how other companies structure their programs and give an SME a sensible place to start.
But the precise hedge ratio should not be treated as an industry constant.
A company with highly predictable contracted revenues may reasonably hedge more of its longer-dated exposure than a company whose revenues depend on uncertain sales forecasts.
The two businesses may face the same currencies and use the same hedging instruments. Their appropriate hedge ratios can still be different.
That is the larger point.
A hedge ratio reflects risk appetite, but it also contains an assumption about how much of your forecast will actually become a real cash flow.
That assumption can be measured.
And once you can measure it, your FX policy no longer has to rely primarily on what everyone else is doing.