Your growth plan has a cash ceiling. Have you calculated it?

- Link copied
Practical working capital management for growing SMEs
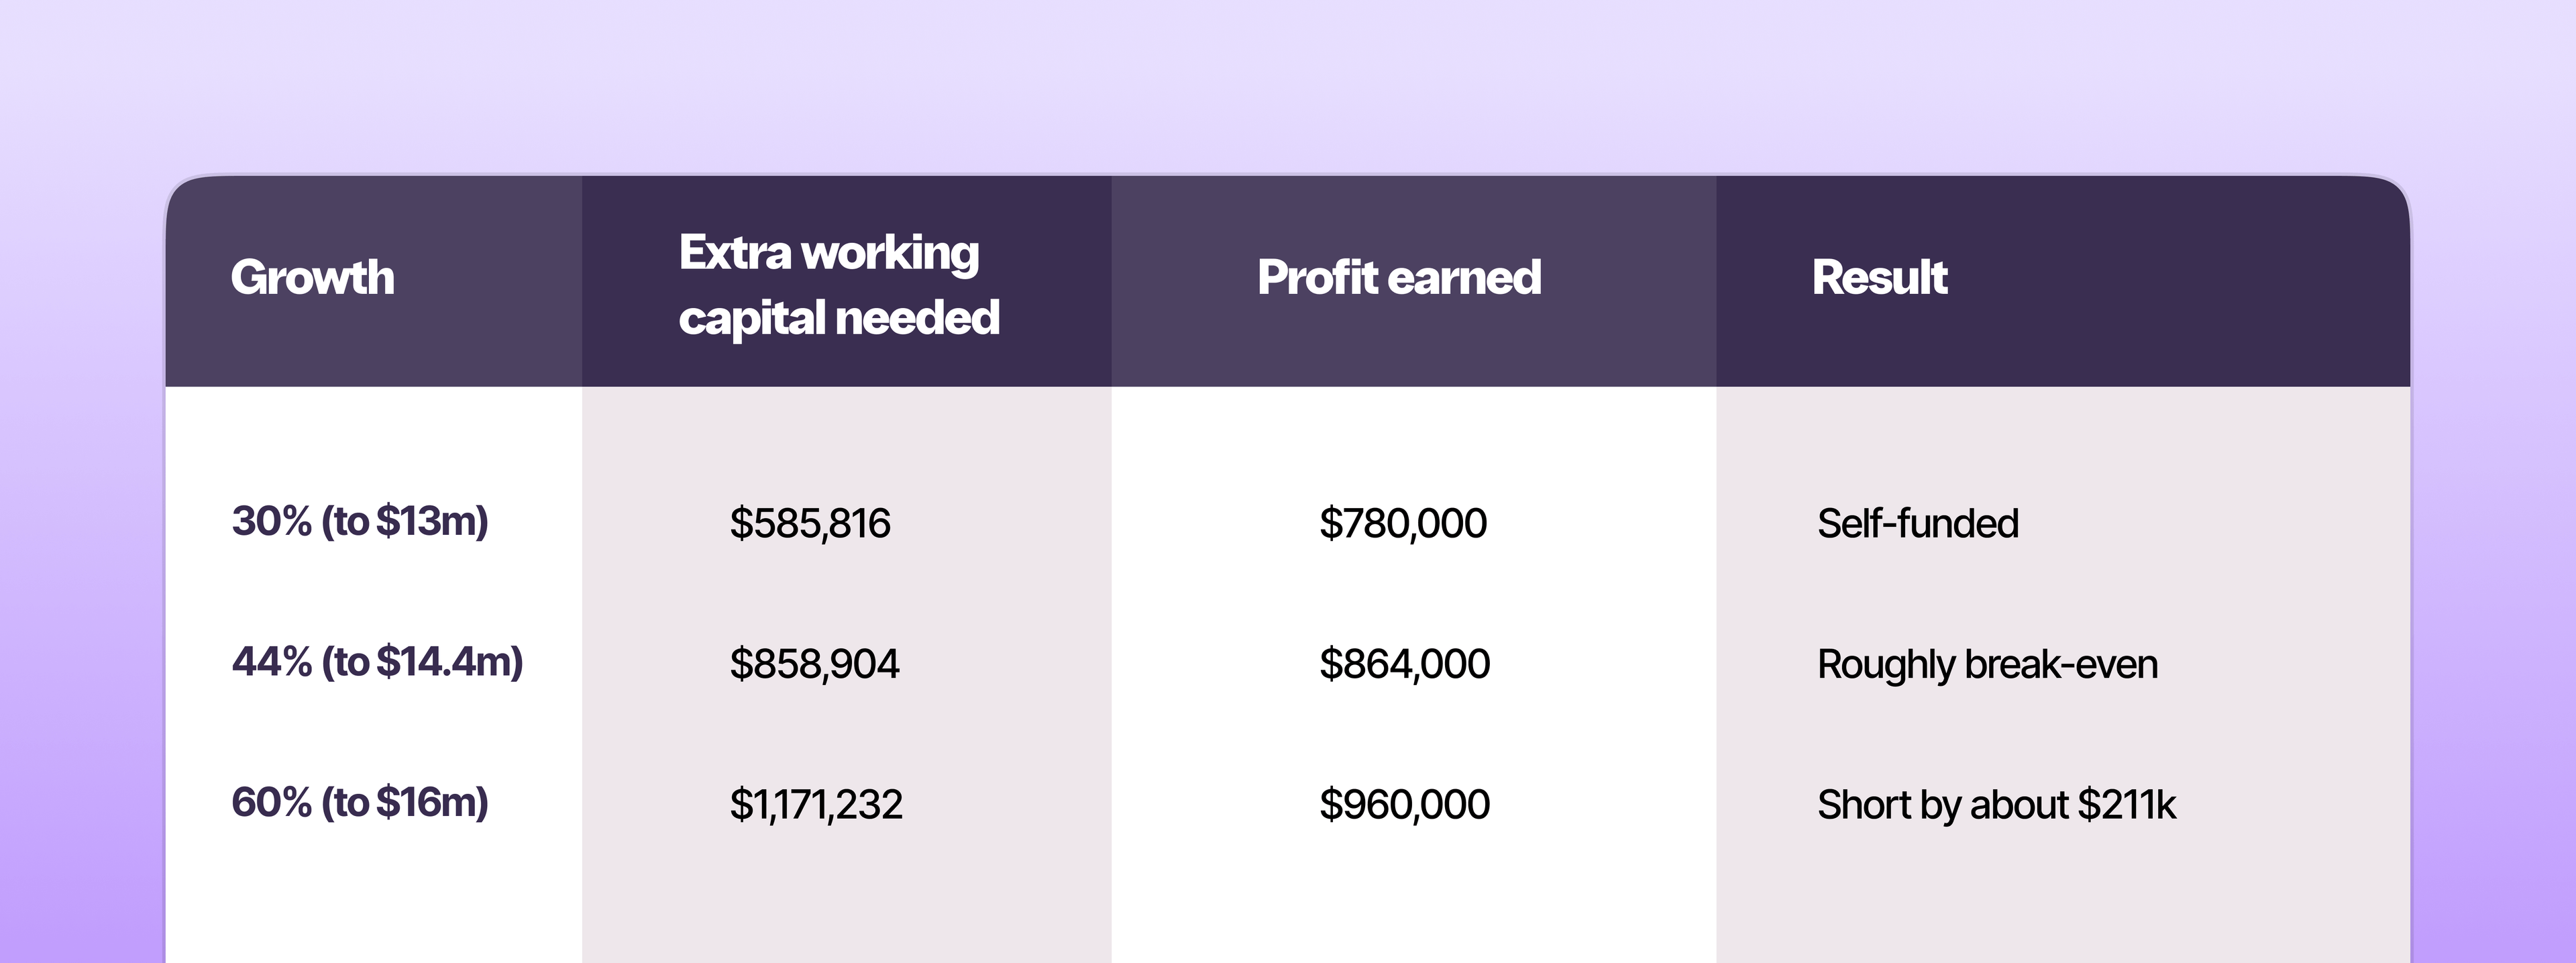
The same business can grow 30% and pay for it out of its own profits, or grow 60% and come up roughly $210,000 short. It stays profitable in both cases. The difference is not margin. It is the cash cycle.
A sales plan is approved in one meeting. The cash it consumes is found in another, usually later, and usually by someone who was not in the first meeting.
That sequence is the problem. Growth is funded before it is earned. A new customer order requires inventory to be bought and paid for, and staff to be paid, weeks or months before the customer settles the invoice. The margin is real. The cash arrives afterward.
For a business with a long cash cycle, this gap widens with every additional dollar of revenue. Growth does not close it. At unchanged operating terms, growth widens it.
This is not a new observation.
Robert Higgins formalized the broader question in 1977: how much growth can a firm afford given its profitability and financial policies? His sustainable-growth framework became a standard corporate-finance tool. The version below is narrower. It isolates the working-capital constraint so an SME finance lead can calculate it from figures already in the accounts.
The result is not a full sustainable-growth model, and it is not a substitute for a cash forecast. It is a first-pass test of how much growth the existing operating cycle can absorb before additional funding is likely to be needed.
The number that is not on the dashboard
Most working capital reporting stops at days. Days Sales Outstanding ("DSO"), Days Inventory Outstanding ("DIO"), Days Payables Outstanding ("DPO"), and the cash conversion cycle that combines them. Useful, but they do not answer the question a growth plan raises. The question is not how many days. It is how many dollars, and how many more dollars next year.
The bridge between the two is working capital intensity: core operating working capital expressed as a percentage of revenue.
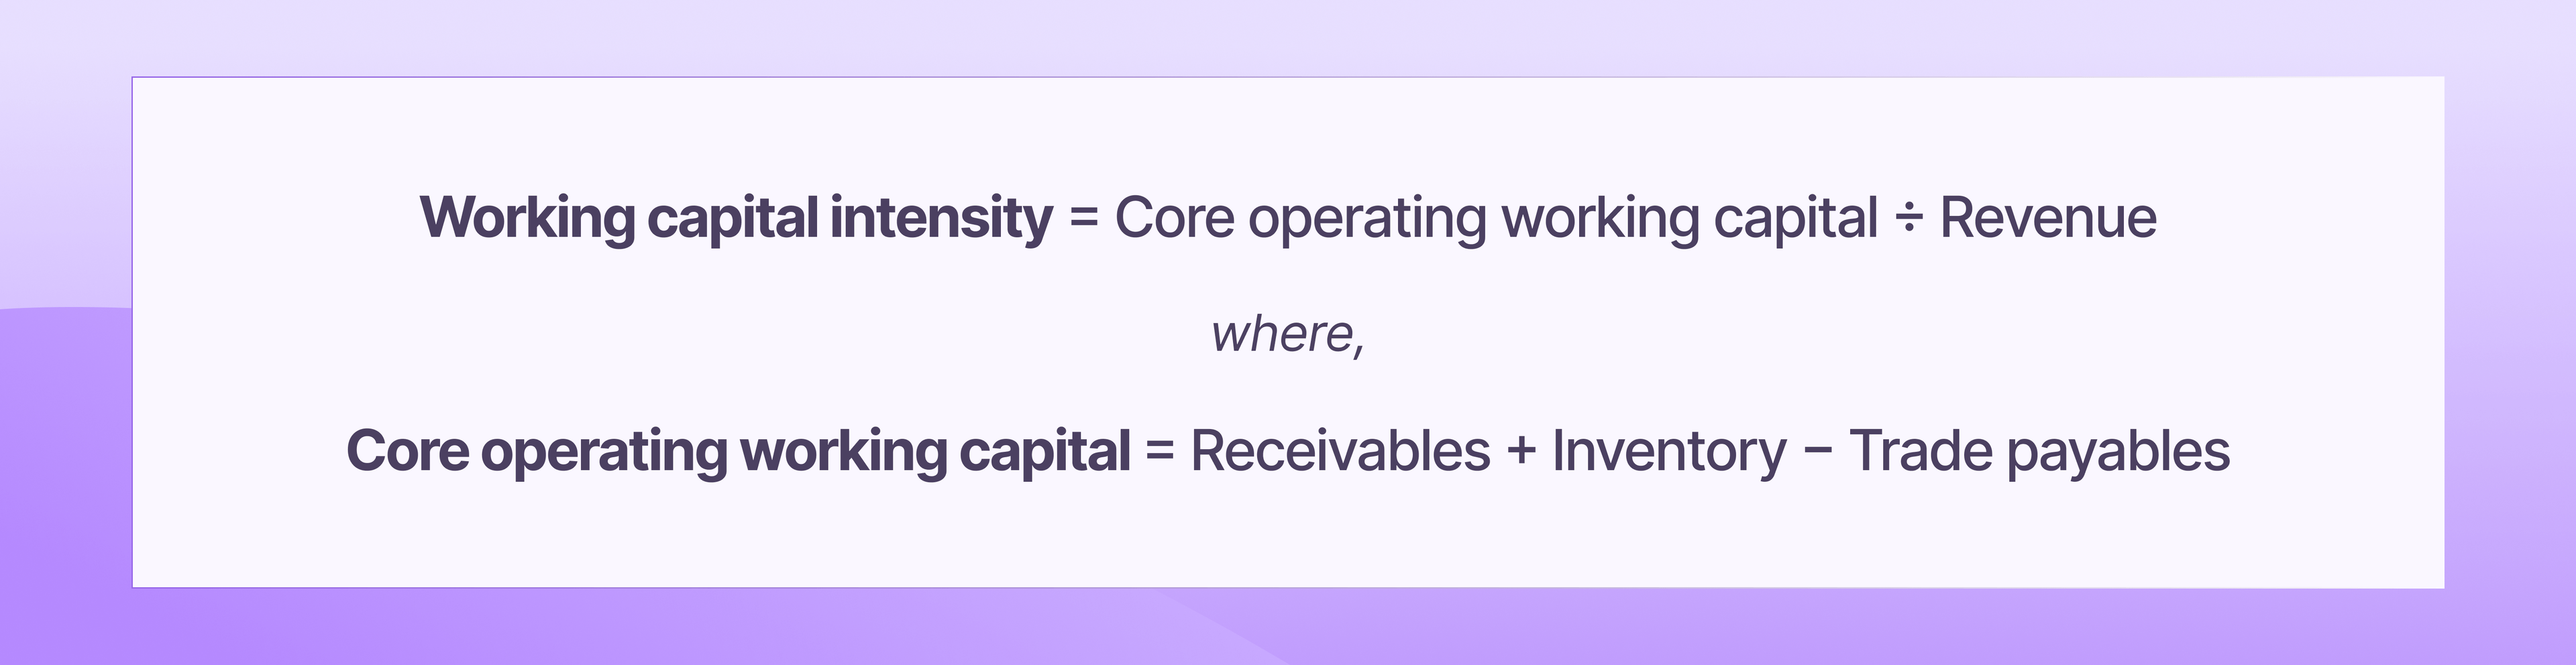
For this article, the measure is deliberately narrow: receivables, inventory and trade payables. A business with material accrued expenses, customer deposits, deferred revenue, project-specific adjustments or other operating current balances should include those as well.
Intensity matters because, if the day-counts and the cost structure remain broadly constant, working capital intensity also remains broadly constant. Every additional dollar of revenue then pulls roughly the same fraction of a dollar into the operating cycle. That makes the incremental requirement calculable in advance rather than discovered later.
One technical point, because it is where this calculation is often done wrong. Receivables scale with revenue. Inventory scales with cost of goods sold. Trade payables are ideally linked to purchases; where purchase data are not readily available, COGS is a common practical proxy. Using revenue as the denominator for all three will distort the requirement in a business with a meaningful gross margin.
Take a distributor with the following profile. The figures are illustrative and chosen to be easy to follow, not drawn from a specific company.
| Input | Value |
|---|---|
| Annual revenue | $10,000,000 |
| Cost of goods sold (65% of revenue) | $6,500,000 |
| DSO | 55 |
| DIO | 60 |
| DPO | 35 |
| Cash conversion cycle | 80 days |
The core operating working capital implied by this profile:
| Component | Calculation | Amount |
|---|---|---|
| Receivables | 55 × ($10.0m ÷ 365) | $1,506,849 |
| Inventory | 60 × ($6.5m ÷ 365) | $1,068,493 |
| Less payables | 35 × ($6.5m ÷ 365) | ($623,288) |
| Core operating working capital | $1,952,054 | |
| Working capital intensity | $1,952,054 ÷ $10.0m | 19.5% |
At this profile, the business carries about 19.5 cents of net operating working capital for every dollar of annual revenue. That is not a problem in itself. It is the financing load created by these customer terms, supplier terms, and inventory policy.
It becomes a planning number the moment revenue moves.
Grow 30%, to $13.0 million, holding the three day-counts and COGS at 65% of revenue constant:
| Component | At $10.0m | At $13.0m | Change |
|---|---|---|---|
| Receivables | $1,506,849 | $1,958,904 | +$452,055 |
| Inventory | $1,068,493 | $1,389,041 | +$320,548 |
| Less payables | ($623,288) | ($810,274) | −$186,986 |
| Core operating working capital | $1,952,054 | $2,537,671 | +$585,617 |
Growing from $10.0 million to $13.0 million in annual revenue increases the working-capital requirement by approximately $586,000. That is 19.5 cents for every dollar of revenue increase - the same intensity applied to the larger business. Cash does not all leave the bank at once; the timing depends on how growth ramps, when inventory is purchased and when customers pay.
The arithmetic is not difficult. Its value is in the timing: run the numbers before the sales target is committed, then pair it with a monthly cash forecast to identify when the funding is actually needed.
The working-capital self-funding ceiling
The next question follows immediately. On an annual basis, how much growth can the business fund increase from its own earnings?
In this simplified model, retained after-tax earnings are the proxy for internally generated funding. Assuming a 6% net margin on $13.0 million, the business generates $780,000 of after-tax earnings. If all of it is retained and available for working capital, that exceeds the $586,000 increase by roughly $194,000.
On this narrow annual test, 30% growth is internally fundable. But that is not the same as saying the company will never need a facility. Working-capital outflows can arrive before the earnings that ultimately fund them, while capital expenditure, debt principal repayments, distributions and other cash uses compete for the same liquidity. A monthly cash forecast is still required to determine the peak funding need.
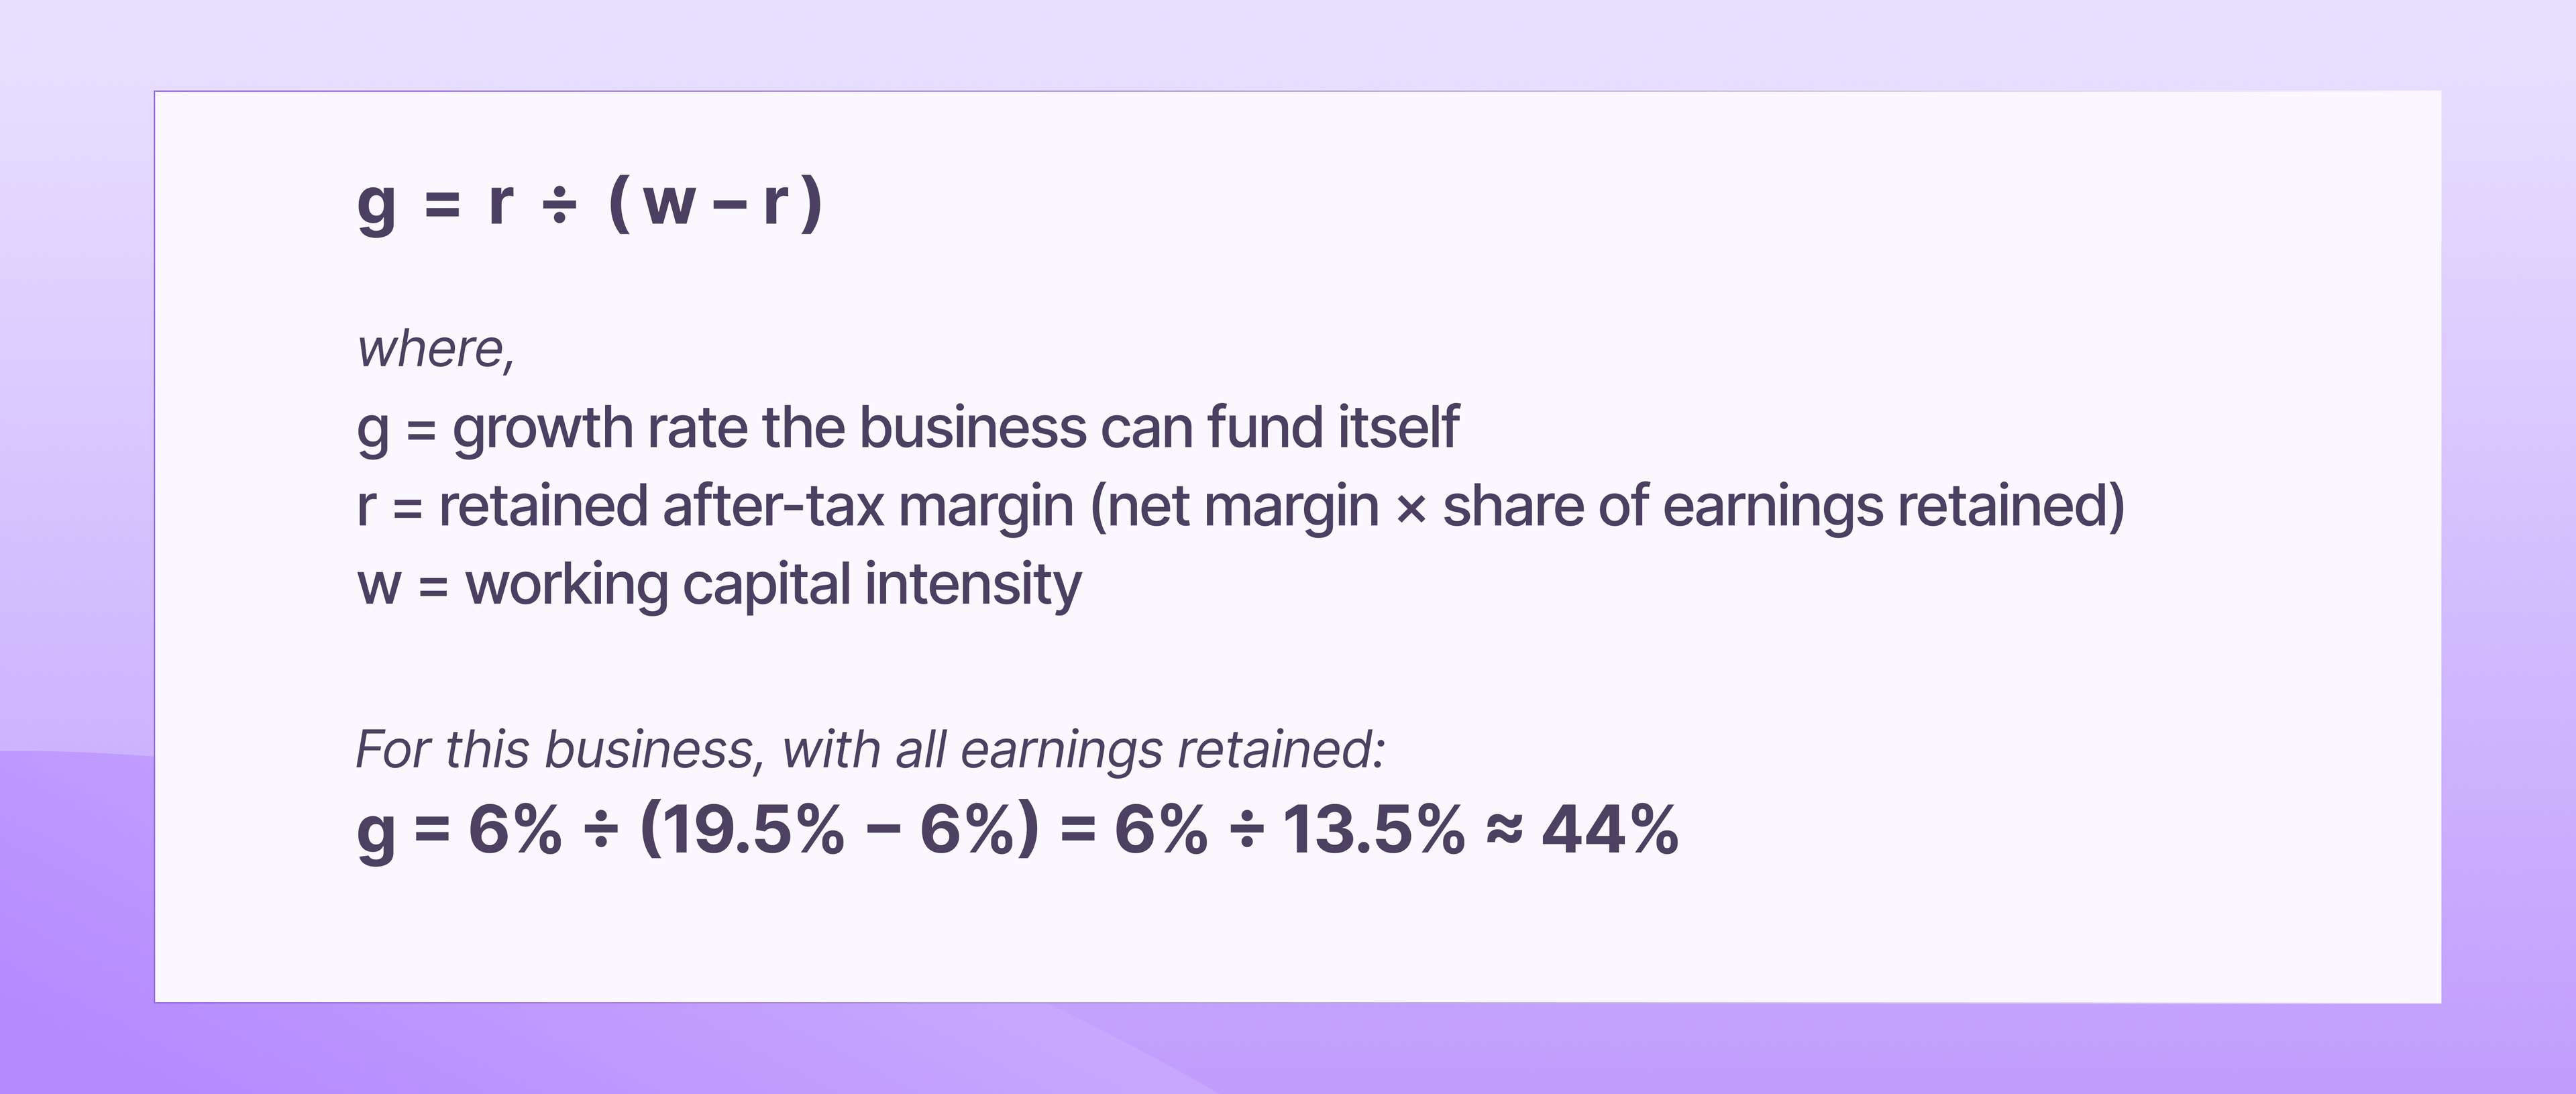
That is the working-capital self-funding ceiling under these assumptions. Above roughly 44%, the annual increase in core working capital exceeds the retained after-tax earnings available to fund it. The difference has to come from outside capital, a financing facility, or a change to one of the operating inputs.
Three limitations, stated plainly. First, this formula covers working capital only; it is not the full Higgins sustainable-growth model. Second, it assumes retained after-tax earnings are available for working capital, with no competing claims such as capital expenditure, debt principal, or distributions. Third, it is an annual balance-sheet test, not a liquidity forecast. If retained margin equals or exceeds working-capital intensity, this working-capital-only formula does not produce a finite ceiling; another constraint becomes binding first.
Three limitations, stated plainly. First, this formula covers working capital only; it is not the full Higgins sustainable-growth model. Second, it assumes retained after-tax earnings are available for working capital, with no competing claims such as capital expenditure, debt principal, or distributions. Third, it is an annual balance-sheet test, not a liquidity forecast. If retained margin equals or exceeds working-capital intensity, this working-capital-only formula does not produce a finite ceiling; another constraint becomes binding first.
What moves the ceiling
Two quantities determine this simplified ceiling: retained margin and working capital intensity. The latter is driven by DSO, DIO, DPO, the cost structure, and any other operating balances included in the model. Margin can be hard to move quickly. The cycle can move on its own, often without a decision being recorded anywhere.
Take one common movement. The company wins larger customers, and those customers pay more slowly. DSO drifts from 55 to 70 - fifteen days, a commercially plausible change that can arrive as part of a sales win rather than a finance event.
| DSO 55 | DSO 70 | |
|---|---|---|
| Receivables | $1,506,849 | $1,917,808 |
| Inventory | $1,068,493 | $1,068,493 |
| Less payables | ($623,288) | ($623,288) |
| Core operating working capital | $1,952,054 | $2,363,013 |
| Working capital intensity | 19.5% | 23.6% |
| Cash conversion cycle | 80 days | 95 days |
| Working-capital self-funding ceiling | 44% | 34% |
Fifteen days of receivables drift reduces the working-capital self-funding ceiling by roughly ten percentage points. The commercial decision may be made in sales. The financing consequence lands in finance.
This is the argument for computing intensity rather than monitoring days alone. Days tell you the cycle lengthened. Intensity tells you what that change does to the amount of capital tied up, and the ceiling formula translates it into the growth rate the business can support under the model.
The same calculation runs in reverse. Pulling DSO back to 55 restores roughly ten percentage points of working-capital self-funding capacity. That is a specific, defensible number to put behind a collections project — more persuasive than a days target because it is expressed in terms of the growth plan management is trying to fund.
The cash does not automatically come back
One distinction matters to how the gap should be funded: is the requirement seasonal, or is it a persistent base level created by a larger business? Confusing the two can create refinancing risk that stays hidden until a facility is renewed or resized.
A sustained step-up in revenue creates a persistent working-capital requirement. If revenue steps up and stays up, the net cash tied up in receivables and inventory, after trade payables, remains committed to the operating cycle. It is released if the business shrinks, the cycle shortens, supplier terms improve, or other operating balances move in the company’s favor.
A seasonal requirement is different. It builds ahead of a peak and then unwinds as inventory converts to sales and receivables convert to cash.
These create different funding profiles. A revolving facility is a natural fit for a seasonal swing because draws can rise and fall with the operating cycle. A revolver can also finance a persistent working-capital base, but if the facility is short-dated, uncommitted, or subject to periodic renewal, the business carries refinancing and availability risk. The longer-lived the requirement, the more important it is to have durable, committed funding capacity.
A practical diagnostic, if the facility is used mainly for working capital: look at the lowest balance over the last twenty-four months. A recurring trough above zero can approximate the non-seasonal portion being financed by that facility — not the company’s total permanent working capital. If that trough is rising year over year, the business may be becoming more structurally reliant on borrowed working-capital funding.
The Federal Reserve’s 2025 Small Business Credit Survey provides useful U.S. context on financing availability. Among employer firms, 38% applied for a loan, line of credit, or merchant cash advance in the prior twelve months. Among applicants, firms that sought financing at small banks were the most likely to be fully approved, at 57%. Availability varies materially by lender and borrower, which is an argument for sizing the requirement before financing becomes urgent.
The ceiling is the point
A growth target is often set from the market: what the pipeline supports, what the competition is doing, what the board expects.
It is also, simultaneously, a financing commitment. At unchanged operating terms, each increment of revenue increases the working capital needed to support the larger business. The company funds that through internally generated cash, external capital, better working-capital terms, or some combination of the three.
Three numbers provide a useful first-pass test: working capital intensity, retained margin, and the resulting self-funding ceiling. They come from figures the business already produces. They are not a liquidity forecast, but they tell you whether the growth plan deserves a financing conversation before it is approved.
Those numbers belong in the growth-plan conversation before the target is committed.
Your pipeline sets what you could sell. Your cash cycle helps determine what you can afford to fund.
References
- Higgins, R. C. (1977). "How Much Growth Can a Firm Afford?" Financial Management, 6(3). The broader sustainable-growth framework linking achievable sales growth to profitability, earnings retention, asset requirements and financial policy.
- Federal Reserve Banks (2026). 2026 Report on Employer Firms: Findings from the 2025 Small Business Credit Survey. fedsmallbusiness.org. Findings from 6,525 U.S. employer firms with 1–499 employees; the survey is a weighted convenience sample, not a random sample.
- Federal Reserve Banks (2026). 2026 Main Street Metrics: Trends over Time from the Small Business Credit Survey. fedsmallbusiness.org. Time-series data on small-employer-firm performance and financing outcomes from 2016 through 2025.
- Office of the Comptroller of the Currency. Asset-Based Lending, Comptroller’s Handbook, Version 1.1 (January 2017; updated March 2025). Discussion of revolving facilities, seasonal working-capital needs, persistent working-capital financing and related credit risks.
This article is provided for general information and educational purposes and does not constitute accounting, legal, tax, investment or financial advice. The figures used are illustrative. Working capital requirements, financing availability, facility terms and accounting treatment are specific to each company and should be confirmed with the company’s auditor, advisers and lenders.