Every working capital lever has a price. Do you know yours?

- Link copied
Practical working capital management for growing SMEs
Pushing supplier payment terms feels like free cash. But suppliers may charge for that extra time in ways you don't immediately see.
BCG research found that suppliers would consider raising prices by 5% to 8% if payment terms stretched 15 to 30 days beyond industry norms. In the example below, a 5% price increase for 20 extra days translates into an implied annual cost of over 90% on the cash released. Far above the company's bank facility of 9%.
Both solve the same liquidity problem. The bank charges interest. The supplier charges indirectly, through higher prices.
Part 2 asks: what does that cash actually cost?
These levers are not simple dials. DSO sits inside customer terms and collections. DPO sits inside supplier economics. DIO sits inside purchasing, lead times, and the service level the business is willing to carry. Finance does not control any of them alone.
Past the free fixes, releasing cash has a price
Collect faster, and you may be asking a customer to change how they pay you. Pay later, and you may be asking a supplier to fund you. Hold less stock, and you are asking the operation to deliver the same service with a thinner buffer. Once you remove process leakage, every day you take out of the cycle becomes an economic or operating trade-off.
This gets missed because the cost rarely arrives labeled. No line in the accounts is called the cost of a working capital action. It arrives as a unit price that drifted up at the last supplier review. An order lost to a competitor offering longer terms. An expedited freight invoice. A customer who stopped calling after repeated stockouts.
Each cost may be small, each has its own explanation, and none is automatically filed against the working capital initiative that helped cause it.
The levers are also not independent. Ordering in smaller, more frequent batches can reduce inventory while weakening your position on supplier pricing or terms. Tightening collections shrinks the receivables balance, which matters if you borrow against receivables. We will come back to that one in Part 3.
Every lever has an implied annual cost rate
A lasting reduction in working capital releases cash when the change takes effect. Keeping working capital at that lower level may then impose a cost every year.
A customer discount, for example, can bring collections forward. But the business continues giving up margin on qualifying sales for as long as it offers that discount. The initial cash release and the recurring cost need to be assessed together.
A useful first-pass comparison is:
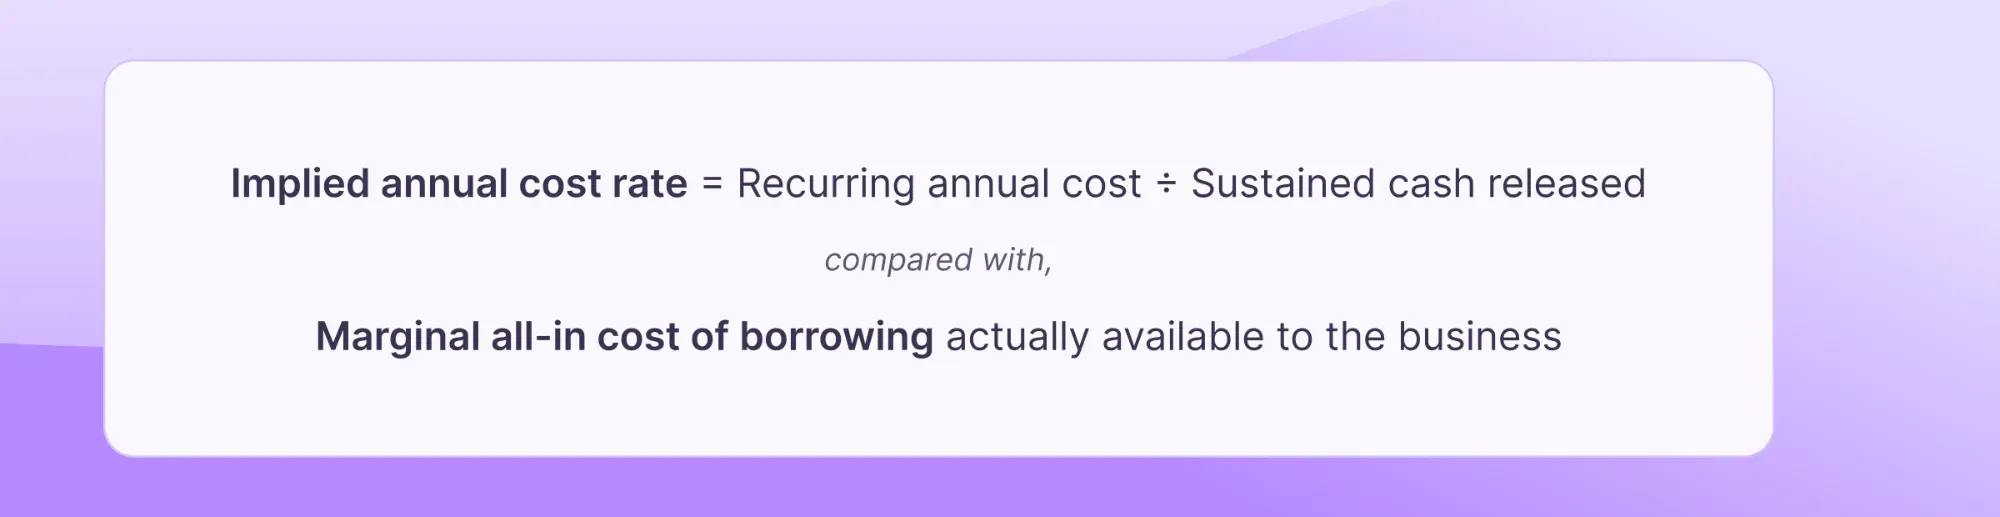
Compare that rate with the marginal all-in cost of borrowing actually available to the business. A lever that costs more than borrowing is usually an expensive way to create liquidity, unless it carries another benefit – or borrowing capacity itself is constrained.
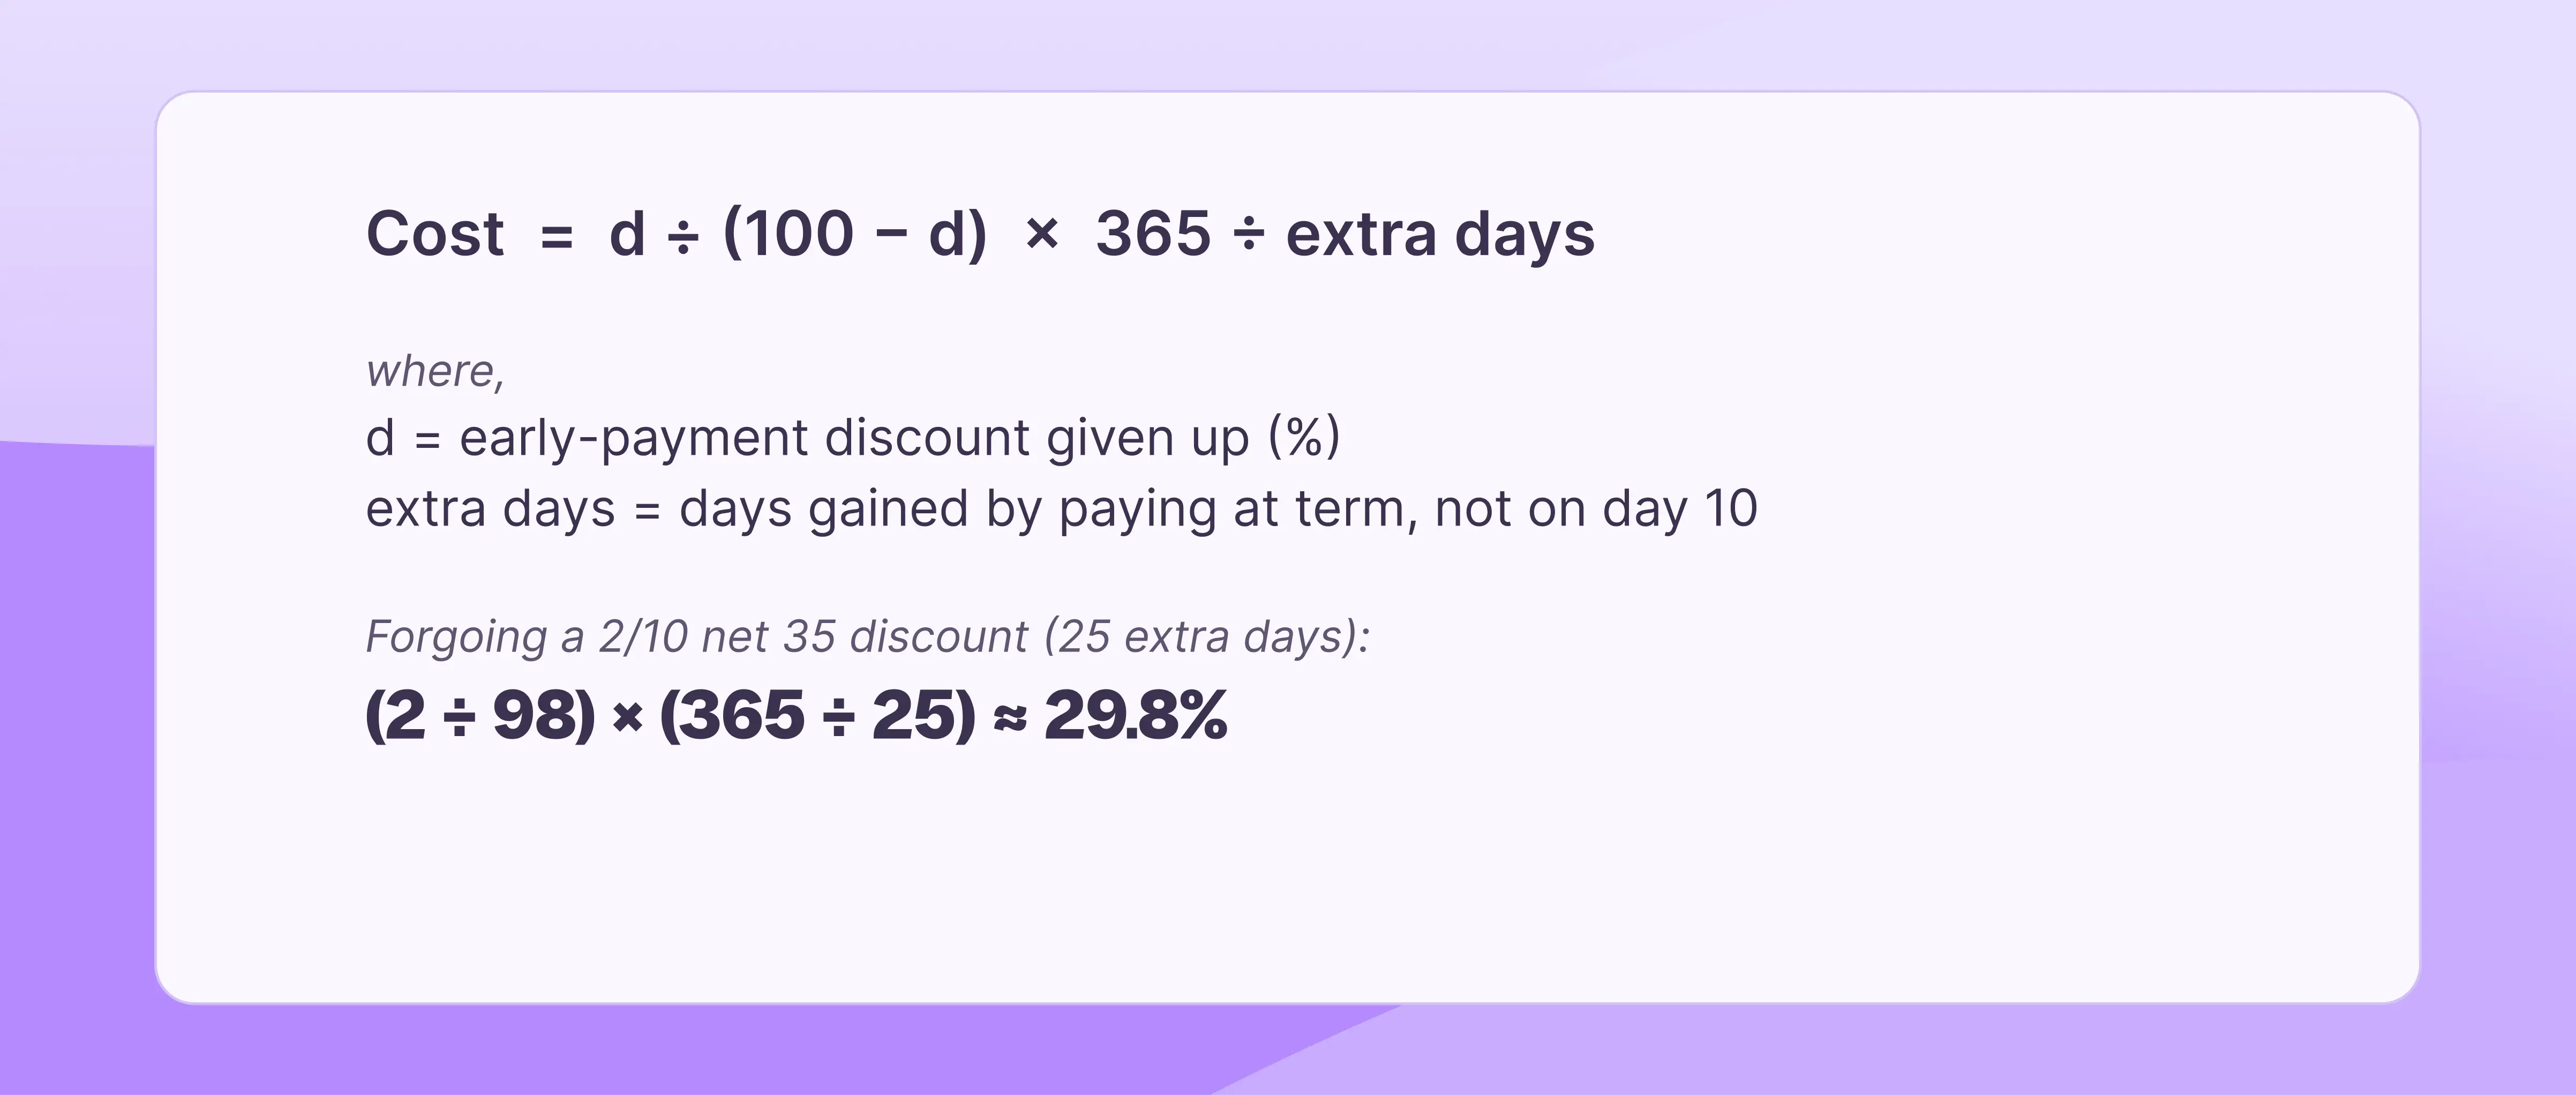
The logic is familiar from the cost of trade credit: a buyer who gives up a 2% discount to take 25 extra days pays a simple annualized cost of about 30% for that extra time. The same first-pass logic applies across the cycle, provided you measure cost and cash release consistently.
The rate is a first-pass screen, not an APR (annual percentage rate) and not a verdict. It works best when the cost recurs annually, and the cash release is sustained. Amortize one-off implementation costs over an appropriate horizon. And some consequences – service risk, supplier resilience, customer behavior – do not resolve cleanly into a percentage.
A priced menu ranks the levers against your facility
Take the same distributor from Part 1: $10.0 million revenue, $6.5 million of cost of goods sold (COGS), DSO 55, DIO 60, DPO 35, working capital intensity 19.5%. Assume its revolving facility has a marginal all-in cost of 9%, with capacity available, and that it has no dedicated collections resource today.
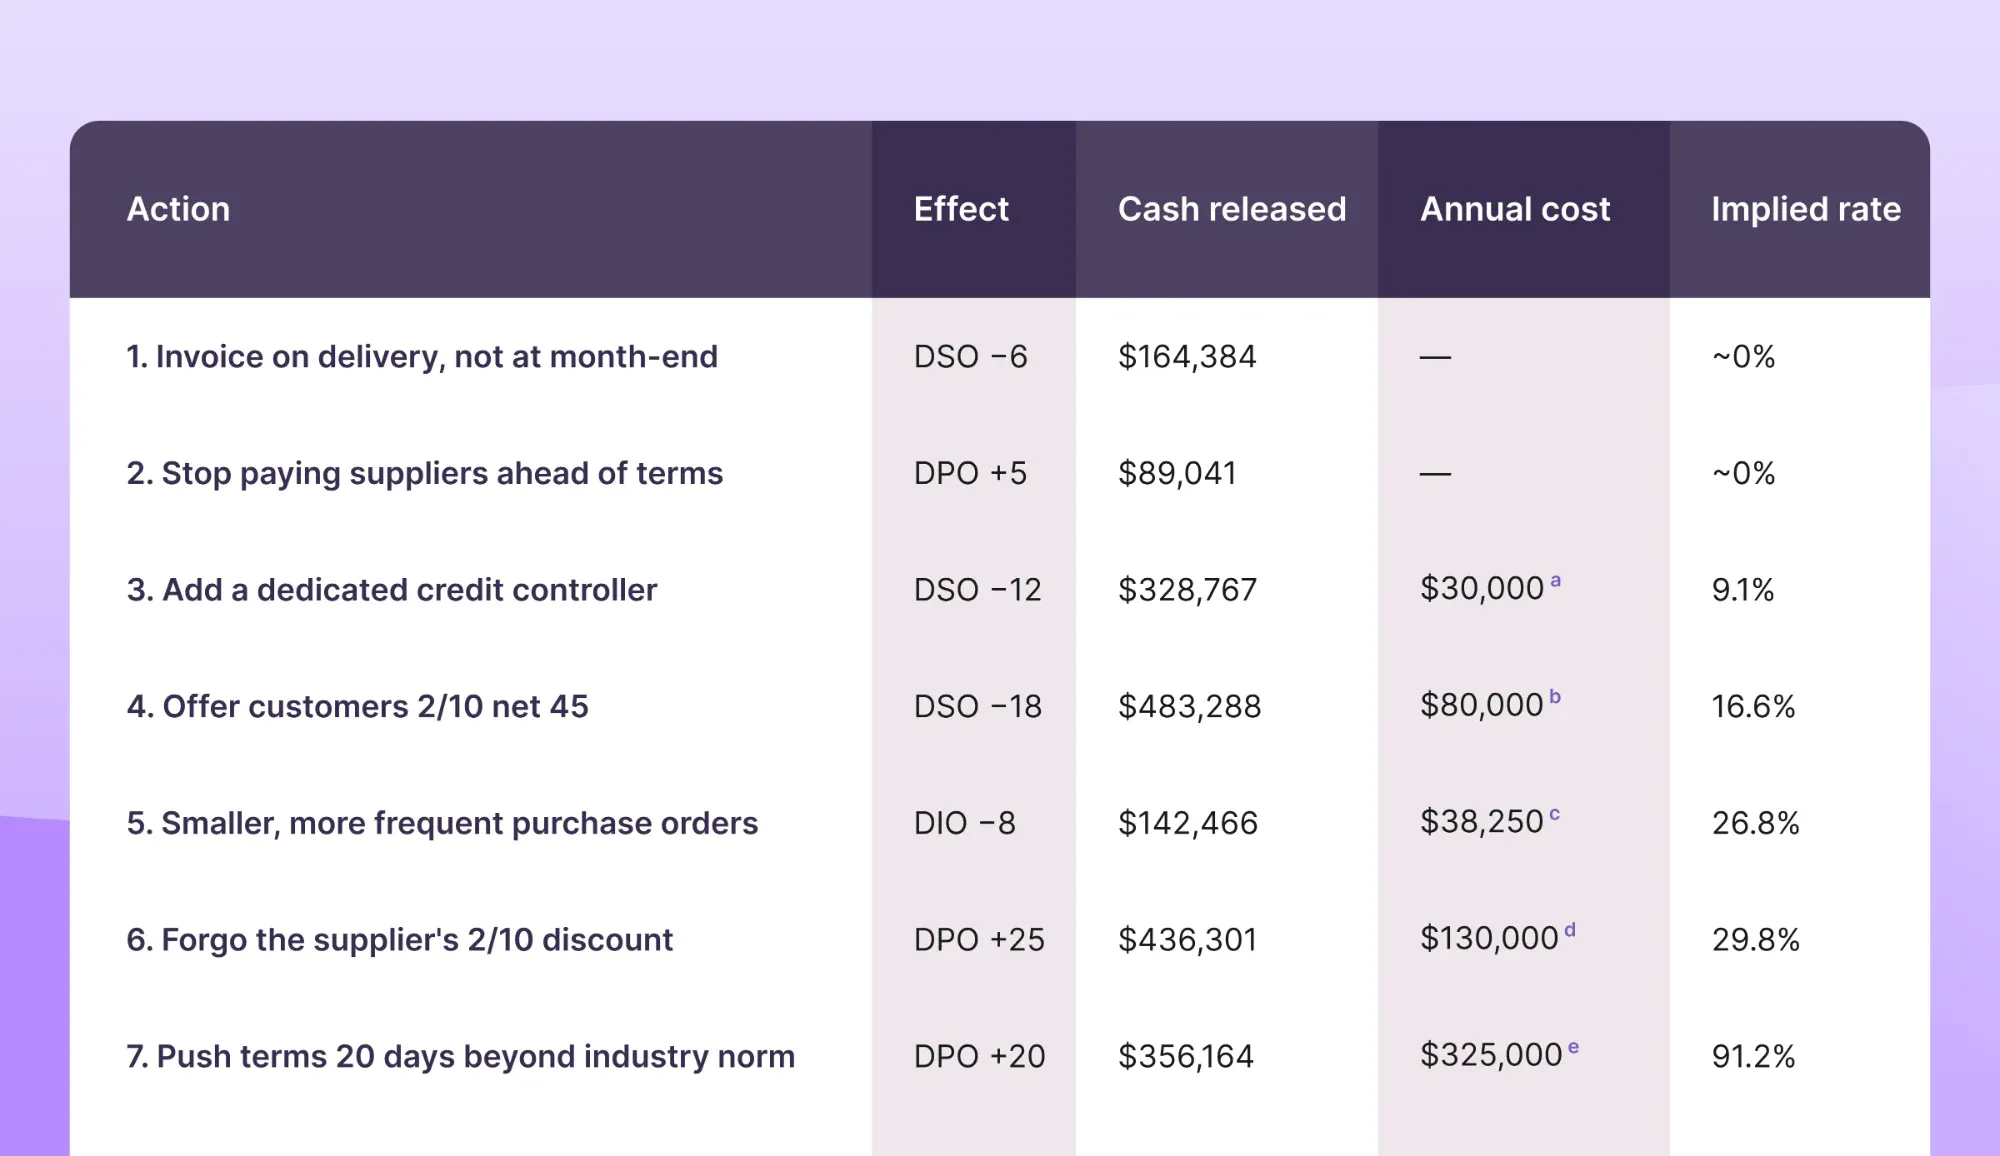
Seven things it could do, each priced against today's baseline.
Assumptions
a. A dedicated credit controller gets customers paying 12 days sooner, releasing $328,767. The cost is the salary: $30,000 a year.
b. 40% of customers take the 2% discount and pay on day 10 instead of day 55, which is 45 days sooner. That brings $3.92m of sales in 45 days earlier, releasing $483,288. The cost is the discount given away: $80,000 a year.
c. Ordering smaller amounts more often cuts stock by 8 days, releasing $142,466. The cost is extra freight, handling and lost bulk discounts: $38,250 a year.
d. Paying on day 35 instead of day 10 means giving up the 2% discount. That keeps $6.37m of payments (after discount) 25 days longer, releasing $436,301. The cost is the discount given up: $130,000 a year.
e. Paying suppliers 20 days past the industry norm keeps $6.5m of payments 20 days longer, releasing $356,164. Suppliers respond with a 5% price rise: $325,000 a year.
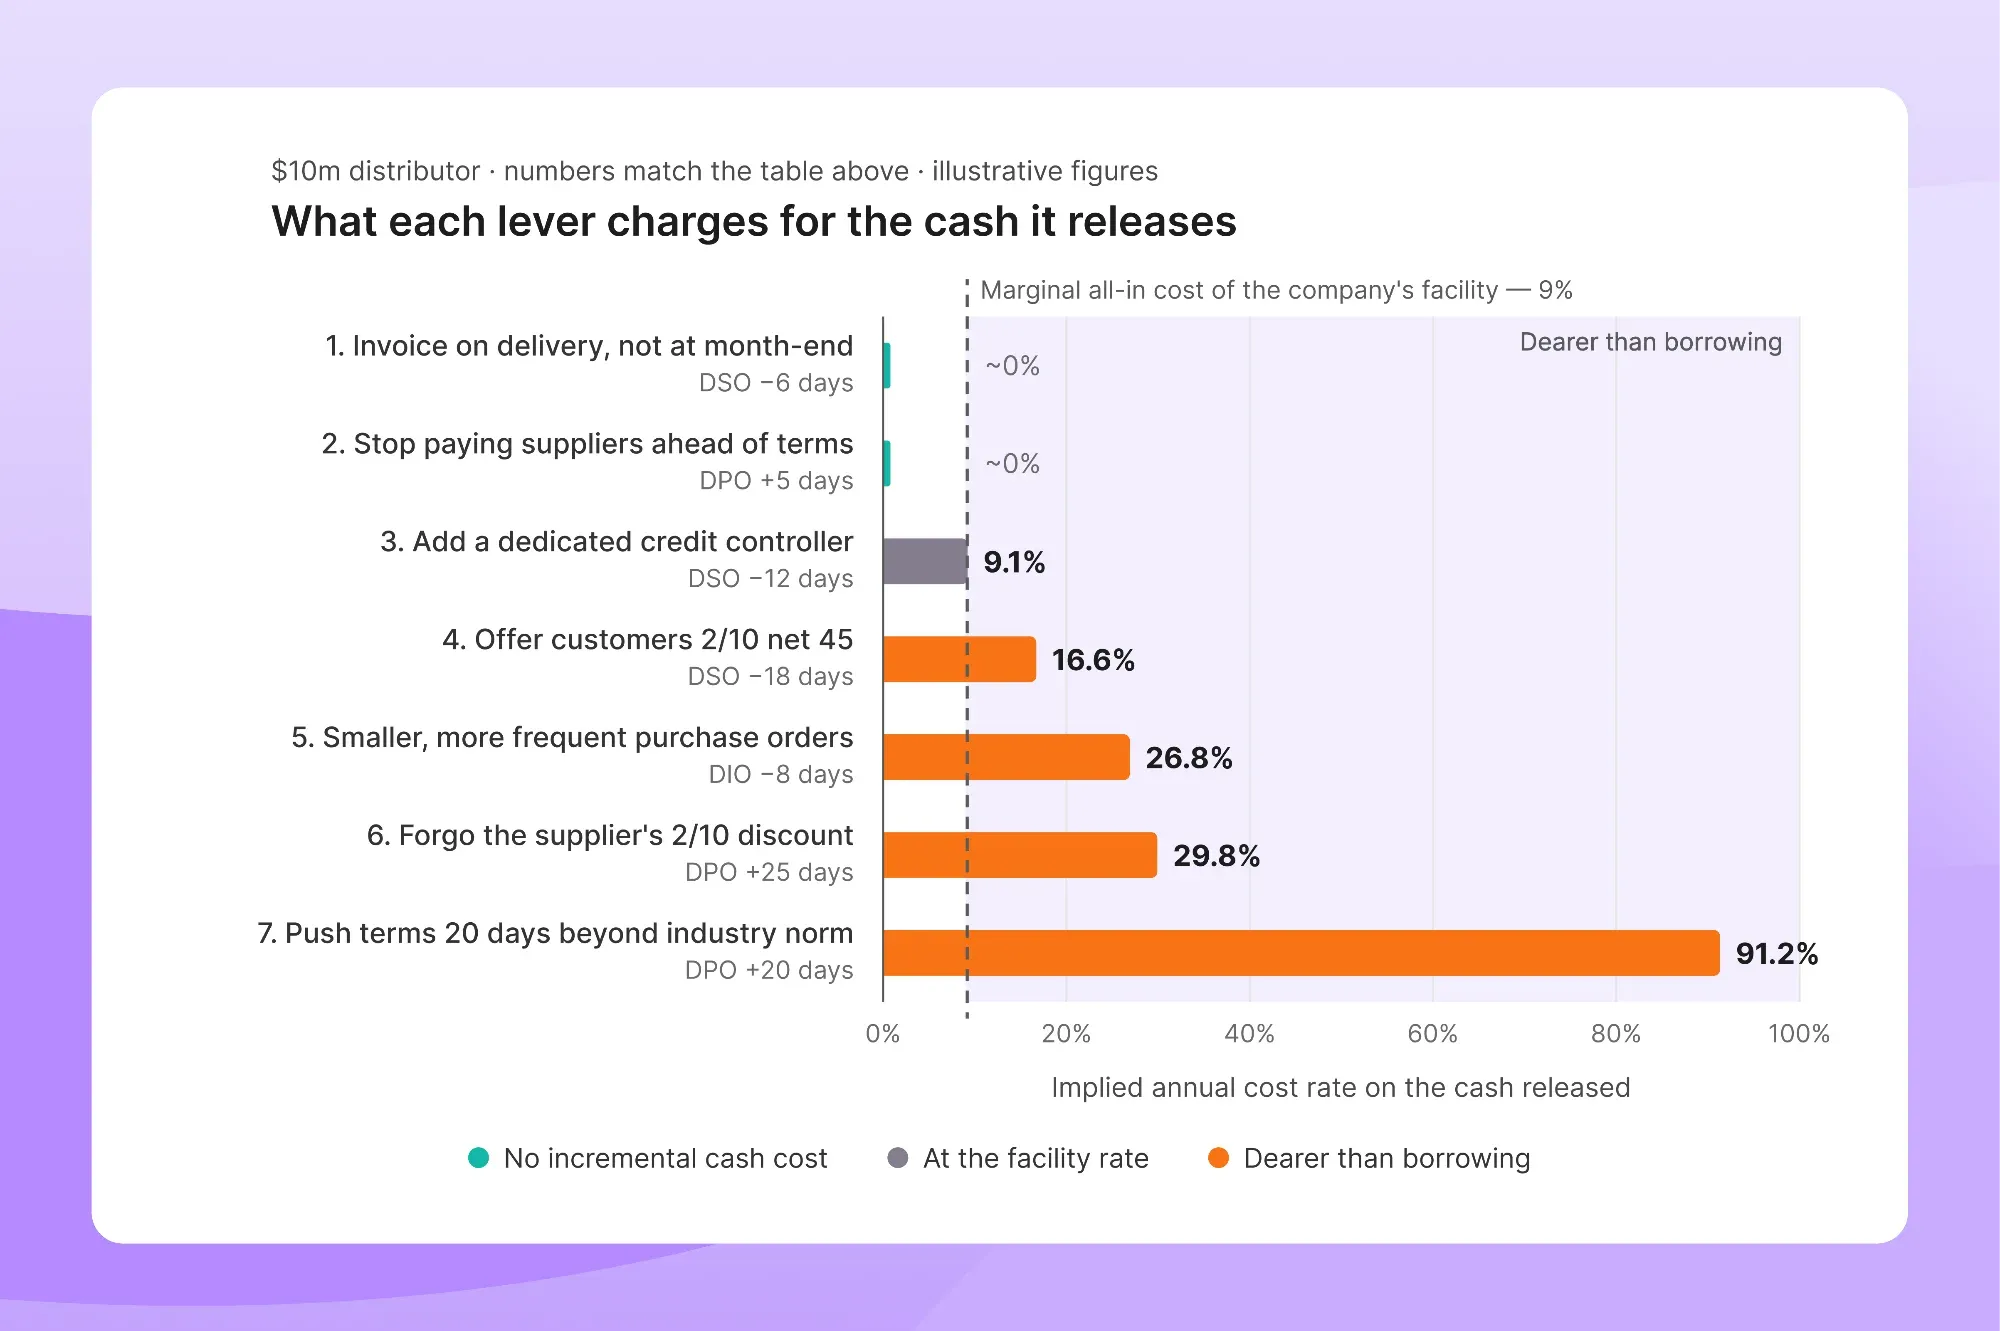
Two actions have no incremental cash cost in this illustration. One sits almost exactly at the facility rate. Four cost more than borrowing – one of them, far more. Illustrative figures.
These are alternatives, not a shopping list. Actions 1, 3 and 4 all speed up collections, so they overlap heavily – you cannot take all three and claim 36 days. Price each one against today's baseline, choose, then re-measure before pricing the next.
Read down the list and the shape of the answer appears before any of the detail does. Two actions release more than $250,000 between them with no incremental cash cost in this scenario. One sits almost exactly on the facility rate, which makes it a genuine judgment call rather than an obvious yes. Four are more expensive than the 9% facility.
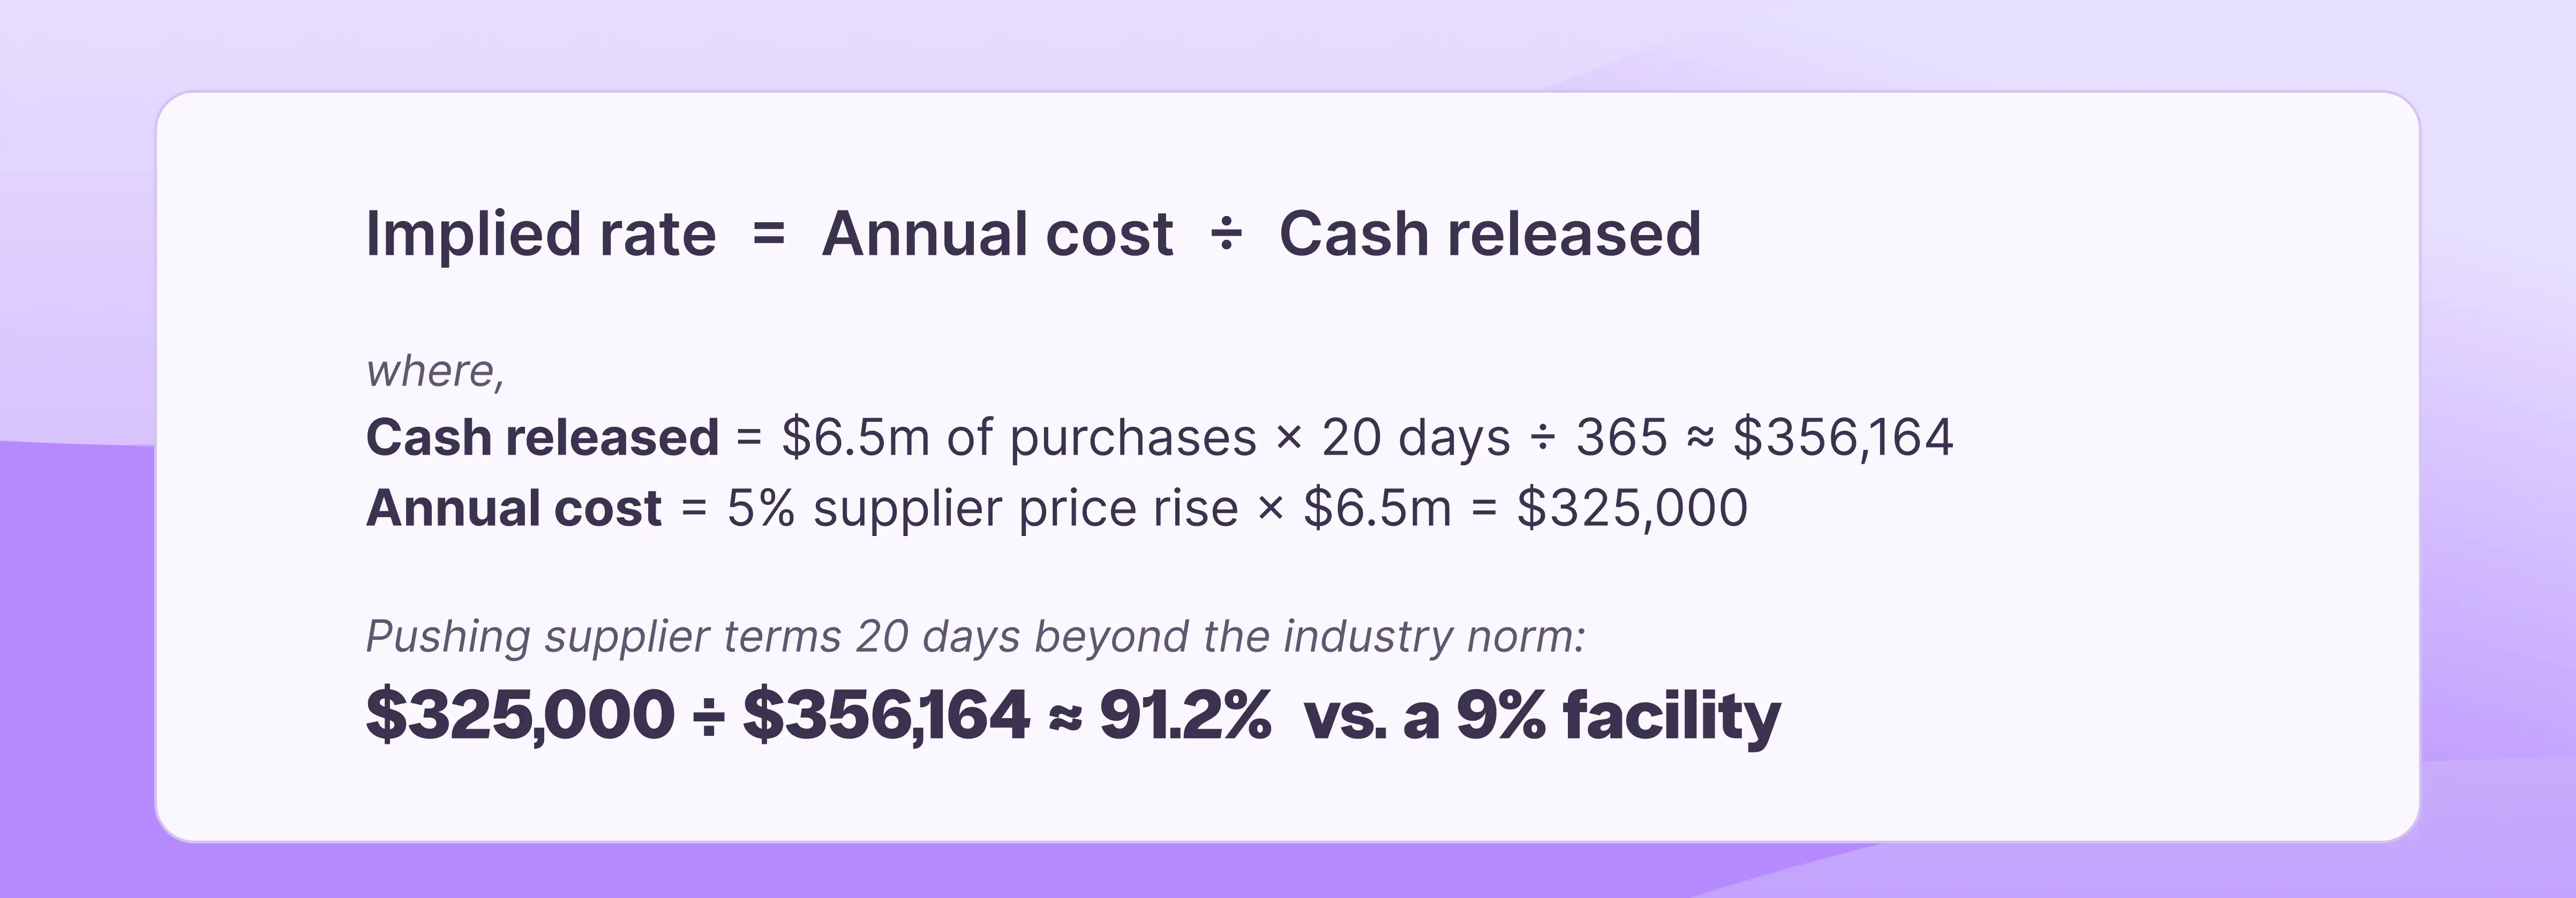
The last line is the one worth sitting with. Under the 5% price-response scenario, pushing supplier terms 20 days beyond the norm releases roughly $356,000 and costs $325,000 a year to sustain. That is a 91.2% simple annual cost rate – just over ten times the 9% facility.
Stretching supplier terms can imply a 90% annual cost
Extending payables is often treated as free because nothing visibly changes when the terms are agreed. The supplier keeps delivering. DPO improves. The working capital report looks better.
Boston Consulting Group documented the trade-off in a 2024 article based in part on a double-blind supplier survey conducted during a client engagement. Most suppliers said they would not raise prices if terms stayed within industry norms. If terms moved 15 to 30 days beyond those norms, suppliers said they would consider price increases of 5% to 8%, directly, or through less visible routes such as surcharges, additional labor hours in estimates, and more change orders. That is not a universal benchmark. It is evidence that the response can be economically material.
Put the low end of that range against the distributor's numbers. Assuming annual purchases are roughly equal to its $6.5 million of COGS, twenty extra days of supplier financing releases about $356,000. Suppose the term extension raises prices by 5% across the whole supplier base; that costs $325,000 every year. The implied simple annual cost rate is 91.2%.
The trade-off can survive inside a business because the two halves are recorded in different places and at different times. Procurement negotiates the terms, and the working capital improvement appears quickly. A price response may arrive months later in cost of goods sold and can be difficult to distinguish from input-cost, mix, or market movements. Unless someone puts the two side by side, you may never test the connection.
A test you can run this week. If you extended supplier terms in the last two years, pull unit prices for your ten largest suppliers from before and after the change. Adjust for product mix, specification changes, and major input-cost movements. Then ask whether any residual increase coincided with the term change. You may not prove causality, but you can test whether part of the working capital gain was purchased through higher unit cost.
The price increase is also the easiest reaction to quantify. Others do not appear cleanly in a ledger: lower priority when supply is short, less flexibility on rush orders, slower response when something goes wrong. For a business with a concentrated supplier base, aggressive terms can also stress supplier liquidity. If a critical supplier fails, the working capital decision becomes a supply-continuity problem.
The right inventory target differs by product line
Cutting inventory has a price too. Ordering smaller amounts more often cuts stock by eight days and releases about $142,000. It also adds $38,250 a year in extra freight, handling, and lost bulk discounts: a 26.8% annual cost, before counting any extra stockouts.
How far you can safely cut depends on the product, how unpredictable demand is, and the service customers expect. That is why "cut inventory by 10%" is not a plan: the right target differs by product line, and the cost of getting it wrong shows up as missed orders, not on an invoice.
Free first, then price the rest
The sequence matters more than the individual choices.
One. Remove leakage before changing economics. Invoice when you deliver if the contract and acceptance process allow it. Stop paying before the due date when no discount or relationship benefit is earned. Resolve disputes quietly holding up invoices. Stop replenishing dead or slow-moving SKUs and decide whether liquidation makes economic sense. Harvest the process fixes before you renegotiate a relationship or lower a service level.
Two. Price what is left. Use recurring annual cost divided by sustained cash released, action by action, and compare it with the marginal all-in cost of available borrowing. For one-off costs, annualize them over the period in which the benefit is expected to last.
Three. Then look at what the rate does not capture. This is where judgment re-enters, and it is not optional:
- A supplier under financial strain becomes a supply-chain risk for you too.
- A customer repeatedly hit by stockouts can cost far more than the margin on the orders you missed.
- The levers interact. Smaller, more frequent orders can reduce inventory and, in the same move, weaken your hand on supplier pricing.
- Management attention can be the binding constraint in a lean finance team. Three initiatives run badly may release less cash than one run properly.
- If the facility is receivables-backed, tightening receivables can also reduce the borrowing base available against them – the subject of Part 3.
Four. Check whether the change actually increases your capacity to fund growth. Recalculate both working capital intensity and retained margin, then rerun the Part 1 ceiling.
Faster collections or lower stock can reduce the cash needed for each additional dollar of sales. Discounts, higher purchase prices, and added operating costs can reduce the profits available to fund those sales. The decision needs to reflect both effects.
That is the calculation from Part 1, run again with the economics of the lever included, which is the only reason to have priced the lever in the first place.
Cash released from the cycle is never a standalone number. It comes from better process, changed timing, or changed risk. The question isn't just how much cash you release, but what you give up to release it.
References
- Kang, T. and Chin, S. M. (2026). "Your growth plan has a cash ceiling. Have you calculated it?" Finmo. Part 1 of this series, covering working capital intensity and the working-capital self-funding ceiling.
- Boston Consulting Group (2024). Avoid the Hidden Costs of Extending Supplier Payment Terms. Bentson, M., Kay, J., Rapp, T., Young, C. and Haenisch, N., June 2024. Reports a double-blind supplier survey conducted during a client engagement: a majority said they would not increase prices within industry norms. In contrast, terms 15 to 30 days beyond those norms could prompt consideration of 5% to 8% price increases, directly or through less visible mechanisms.
- Cost of trade credit. A common simple annualized cost calculation is: (discount ÷ (100 − discount)) × (days in year ÷ additional days of credit). Day-count conventions vary. For 2/10 net 35 using 365 days, that is (2 ÷ 98) × (365 ÷ 25) ≈ 29.8%. OpenStax, Principles of Finance 2e, §19.2, illustrates the same approach using a 360-day convention.
This article is provided for general information and educational purposes and does not constitute accounting, legal, tax, investment or financial advice. The figures used are illustrative. Working capital requirements, supplier and customer terms, financing availability and facility terms are specific to each company and should be confirmed with the company's auditor, advisers and lenders.
About the authors
Thomas Kang
Tom is Co-Founder and Chief Strategy Officer of Finmo, bringing over 25 years of experience across corporate treasury, institutional banking, fintech, and venture capital. Having worked on both sides of the treasury equation - from corporate finance at Agilent Technologies to senior leadership roles at Citi, Rapyd, and M-DAQ - he brings a practitioner’s understanding of day-to-day treasury operations and challenges. His expertise spans cash and liquidity management, FX risk, and cross-border payments. At Finmo, Tom applies this experience to building practical technology solutions that help finance teams simplify treasury operations, improve financial visibility, and make better decisions.
Shi Mei Chin
Shi Mei is a fractional CFO, Founder of CFO Influence, and a member of Finmo’s CFO & Treasurer Advisory Board, bringing over 15 years of experience across high-growth fintech, institutional capital, and boardroom strategy. A Chartered Accountant and CIMA, she trained at PwC Audit & Assurance and EY Financial Services before serving as CFO of a tier-1-backed fintech. There she led fundraising from Series A through Series C and raised over US$30 million, alongside SPAC negotiations, IPO readiness, and M&A processes. Named one of the 2025 Top 10 CFOs in Southeast Asia, Shi Mei brings a practitioner’s view of fundraising, strategic finance, and building finance functions that scale.